Here is a full live example of debugging a microservices failure — exactly how it happens in real companies (Netflix, Uber, Amazon style).
This example will make the entire debugging process crystal clear. 👇
🎯 Scenario: Order Placement Failure in a Microservices System
User tries to place an order:
/placeOrder
But the user gets:
500 Internal Server Error
We have these microservices:
-
API Gateway
-
Order Service
-
Payment Service
-
Inventory Service
-
Notification Service
🔥 Step 1: Check Logs in Centralized Logging (ELK)
We search for Correlation ID:
X-Correlation-ID: 8ab12c
We find the logs:
Order Service → Calling Payment Service...
Payment Service → Timeout when calling Bank API
Order Service → Payment Failed
🔍 Insight
Payment Service timed out while calling external Bank API.
But we need more clarity → go to distributed tracing.
🔥 Step 2: Open Distributed Tracing (Jaeger / Zipkin)
Trace ID: 8ab12c
You see this:

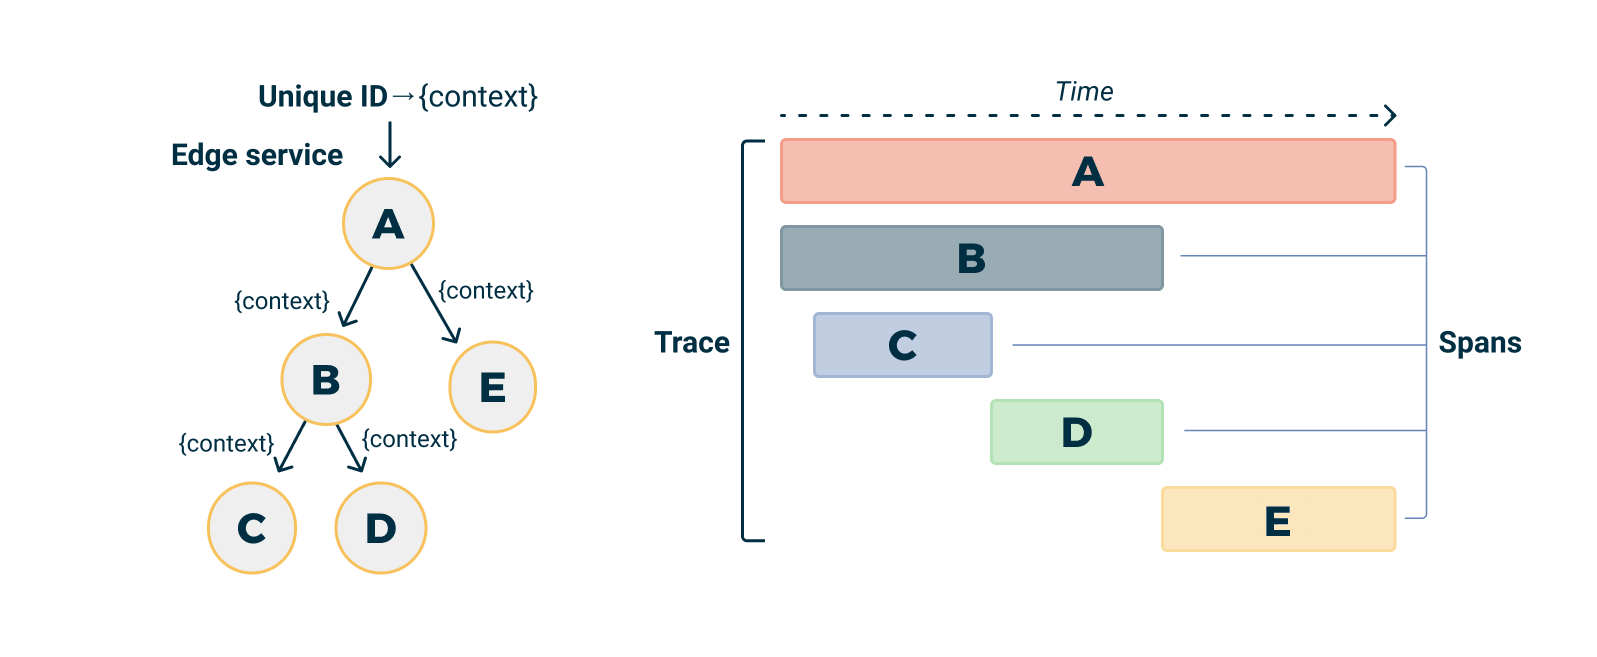
Timeline diagram shows:
API Gateway → Order Service → Payment Service → Bank API (timeout)
👉 The slowest span is Payment → Bank API
👉 Bank API took 12 seconds
👉 But our timeout is 3 seconds
🔍 Root Cause
Bank API is responding too slowly → causing Payment Service to fail → causing Order failure.
🔥 Step 3: Check Metrics (Prometheus + Grafana)
Graphs show:
-
Payment Service latency (p99) increased to 10 seconds
-
Error rate for Payment Service spiked to 65%
-
CPU & memory are normal (so not resource issue)
This confirms:
👉 The bottleneck is external Bank API, not our services.
🔥 Step 4: Check Kubernetes Pod Health
Run commands:
kubectl get pods -n prod
kubectl describe pod payment-service-xyz
kubectl logs payment-service-xyz
Logs show:
java.net.SocketTimeoutException: Read timed out
Retrying...
CircuitBreaker: OPEN
🔍 Meaning
The circuit breaker opened, so Payment Service started failing immediately to avoid cascading failures.
🔥 Step 5: Reproduce the Issue Manually
We call Bank API directly:
curl https://bankapi.example.com/authorize?amount=500
Result:
Response took 11,230 ms
🔍 Conclusion
Bank API is definitely slow.
🔥 Step 6: Check Recent Deployments / Changes
Use Git or CI/CD logs:
Payment Service v2.3 deployed 2 hours ago
Changes: Added encryption & validation → increased payload size by 40%
Possible reasons:
-
New payload size causes Bank API bottleneck
-
New encryption increased processing time
🔥 Step 7: Apply Temporary Fix
Quick mitigation:
-
Increase Payment Service → Bank API timeout from 3s to 8s
-
Increase retry delay
-
Reduce payload size (remove unwanted fields)
Apply config change:
timeout = 8000ms
retry = 1
Redeploy:
kubectl rollout restart deployment payment-service
🔥 Step 8: Observe the System After Fix
Metrics after fix:
-
Latency drops from 10s → 2s
-
Error rate drops from 65% → 1%
-
Circuit breaker closes
-
Order flow is successful again
User can place orders now!
🧠 End-to-End Debugging Summary (LIVE EXAMPLE)
| Step | What We Found | Tool |
|---|---|---|
| 1 | Payment timeout in logs | ELK |
| 2 | Bank API span slow | Jaeger |
| 3 | Payment latency spike | Grafana |
| 4 | Timeout exception in pods | kubectl logs |
| 5 | Bank API slow manually | curl |
| 6 | Change in deployment | Git / CI-CD |
| 7 | Applied fix | Config update |
| 8 | System stable | Grafana |
🏆 Final Real-World Root Cause
Bank API became slow due to increased payload size introduced in the latest deployment.
🎁 Want an even better example?
I can give you:
✅ Debugging example for Kafka failure
✅ Debugging example for Database failure
✅ Debugging example for Service Mesh (Istio) routing failure
Just tell me which one you want!
No comments:
Post a Comment